|
Download Data (XLS File) |
|
|||||
|
|||||
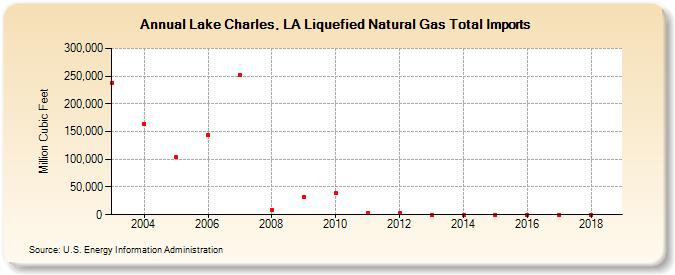
| Lake Charles, LA Liquefied Natural Gas Total Imports (Million Cubic Feet) | |||||
| Decade | Year-0 | Year-1 | Year-2 | Year-3 | Year-4 | Year-5 | Year-6 | Year-7 | Year-8 | Year-9 |
|---|---|---|---|---|---|---|---|---|---|---|
| 2000's | 238,237 | 163,738 | 103,770 | 143,608 | 251,455 | 8,898 | 31,348 | |||
| 2010's | 39,037 | 2,282 | 2,514 | 0 | 0 | 0 | 0 | 0 | 0 |
| - = No Data Reported; -- = Not Applicable; NA = Not Available; W = Withheld to avoid disclosure of individual company data. |
| Release Date: 12/31/2025 |
| Next Release Date: 1/30/2026 |