|
Download Data (XLS File) |
|
|||||
|
|||||
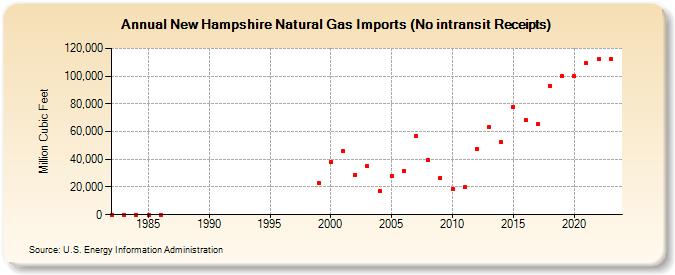
| New Hampshire Natural Gas Imports (No intransit Receipts) (Million Cubic Feet) | |||||
| Decade | Year-0 | Year-1 | Year-2 | Year-3 | Year-4 | Year-5 | Year-6 | Year-7 | Year-8 | Year-9 |
|---|---|---|---|---|---|---|---|---|---|---|
| 1980's | 0 | 0 | 0 | 0 | 0 | |||||
| 1990's | 22,820 | |||||||||
| 2000's | 38,289 | 45,808 | 29,014 | 34,983 | 17,257 | 28,041 | 31,853 | 56,879 | 39,438 | 26,767 |
| 2010's | 18,297 | 19,826 | 47,451 | 63,446 | 52,160 | 77,866 | 68,545 | 65,257 | 93,181 | 100,086 |
| 2020's | 99,821 | 109,240 | 112,461 | 112,683 | 131,056 |
| - = No Data Reported; -- = Not Applicable; NA = Not Available; W = Withheld to avoid disclosure of individual company data. |
| Release Date: 6/30/2026 |
| Next Release Date: 7/31/2026 |