|
Download Data (XLS File) |
|
|||||
|
|||||
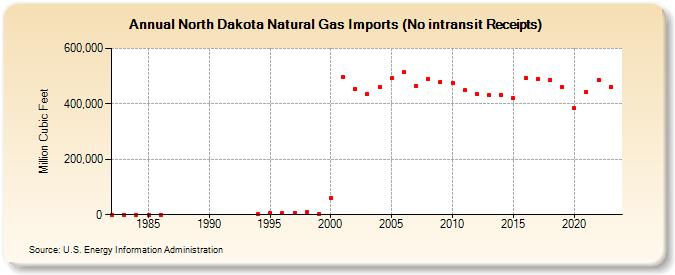
| North Dakota Natural Gas Imports (No intransit Receipts) (Million Cubic Feet) | |||||
| Decade | Year-0 | Year-1 | Year-2 | Year-3 | Year-4 | Year-5 | Year-6 | Year-7 | Year-8 | Year-9 |
|---|---|---|---|---|---|---|---|---|---|---|
| 1980's | 0 | 0 | 0 | 0 | 0 | |||||
| 1990's | 1,617 | 4,559 | 6,110 | 7,672 | 9,268 | 3,416 | ||||
| 2000's | 60,718 | 495,568 | 453,645 | 435,453 | 460,237 | 491,867 | 514,052 | 465,973 | 490,045 | 480,013 |
| 2010's | 476,864 | 448,977 | 433,721 | 432,509 | 433,256 | 419,835 | 493,100 | 489,868 | 487,071 | 460,986 |
| 2020's | 383,491 | 443,555 | 486,081 | 461,922 | 473,550 |
| - = No Data Reported; -- = Not Applicable; NA = Not Available; W = Withheld to avoid disclosure of individual company data. |
| Release Date: 6/30/2026 |
| Next Release Date: 7/31/2026 |