|
Download Data (XLS File) |
|
||||||||
|
||||||||
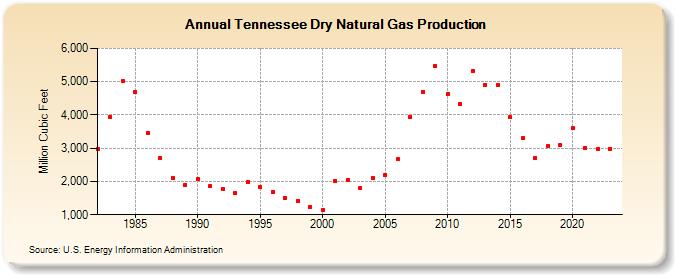
| Tennessee Dry Natural Gas Production (Million Cubic Feet) | ||||||||
| Decade | Year-0 | Year-1 | Year-2 | Year-3 | Year-4 | Year-5 | Year-6 | Year-7 | Year-8 | Year-9 |
|---|---|---|---|---|---|---|---|---|---|---|
| 1980's | 2,976 | 3,950 | 5,022 | 4,686 | 3,464 | 2,707 | 2,100 | 1,900 | ||
| 1990's | 2,067 | 1,856 | 1,770 | 1,660 | 1,990 | 1,820 | 1,690 | 1,510 | 1,420 | 1,230 |
| 2000's | 1,150 | 2,000 | 2,050 | 1,803 | 2,100 | 2,200 | 2,663 | 3,942 | 4,700 | 5,478 |
| 2010's | 4,638 | 4,335 | 5,324 | 4,912 | 4,912 | 3,937 | 3,305 | 2,705 | 3,056 | 3,093 |
| 2020's | 3,595 | 3,000 | 2,985 | 2,648 | 2,642 |
| - = No Data Reported; -- = Not Applicable; NA = Not Available; W = Withheld to avoid disclosure of individual company data. |
| Release Date: 6/30/2026 |
| Next Release Date: 7/31/2026 |