|
Download Data (XLS File) |
|
||||||||
|
||||||||
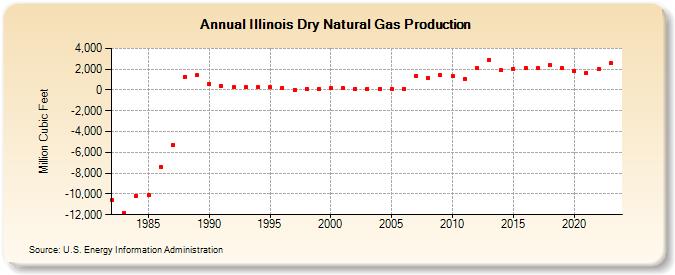
| Illinois Dry Natural Gas Production (Million Cubic Feet) | ||||||||
| Decade | Year-0 | Year-1 | Year-2 | Year-3 | Year-4 | Year-5 | Year-6 | Year-7 | Year-8 | Year-9 |
|---|---|---|---|---|---|---|---|---|---|---|
| 1980's | -10,579 | -11,813 | -10,157 | -10,112 | -7,372 | -5,291 | 1,277 | 1,396 | ||
| 1990's | 596 | 366 | 247 | 254 | 253 | 258 | 234 | 31 | 139 | 140 |
| 2000's | 147 | 150 | 133 | 126 | 121 | 120 | 123 | 1,346 | 1,151 | 1,412 |
| 2010's | 1,357 | 1,078 | 2,125 | 2,887 | 1,882 | 2,038 | 2,141 | 2,089 | 2,425 | 2,112 |
| 2020's | 1,812 | 1,609 | 1,974 | 2,554 | 3,164 |
| - = No Data Reported; -- = Not Applicable; NA = Not Available; W = Withheld to avoid disclosure of individual company data. |
| Release Date: 6/30/2026 |
| Next Release Date: 7/31/2026 |