|
Download Data (XLS File) |
|
||||||||
|
||||||||
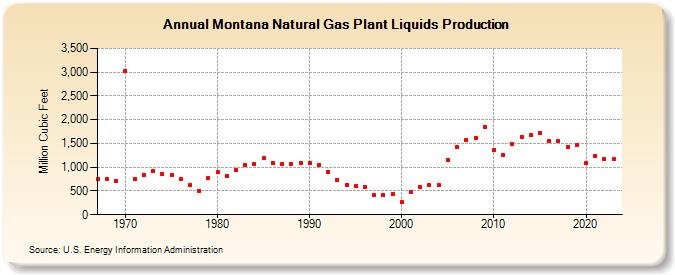
| Montana Natural Gas Plant Liquids Production (Million Cubic Feet) | ||||||||
| Decade | Year-0 | Year-1 | Year-2 | Year-3 | Year-4 | Year-5 | Year-6 | Year-7 | Year-8 | Year-9 |
|---|---|---|---|---|---|---|---|---|---|---|
| 1960's | 744 | 744 | 705 | |||||||
| 1970's | 3,032 | 750 | 839 | 918 | 857 | 831 | 761 | 630 | 503 | 776 |
| 1980's | 890 | 818 | 940 | 1,049 | 1,069 | 1,189 | 1,086 | 1,058 | 1,072 | 1,095 |
| 1990's | 1,091 | 1,055 | 907 | 741 | 631 | 597 | 576 | 409 | 410 | 435 |
| 2000's | 272 | 470 | 575 | 615 | 634 | 1,149 | 1,422 | 1,576 | 1,622 | 1,853 |
| 2010's | 1,367 | 1,252 | 1,491 | 1,645 | 1,670 | 1,730 | 1,547 | 1,551 | 1,434 | 1,460 |
| 2020's | 1,082 | 1,240 | 1,164 | 1,228 | 1,194 |
| - = No Data Reported; -- = Not Applicable; NA = Not Available; W = Withheld to avoid disclosure of individual company data. |
| Release Date: 6/30/2026 |
| Next Release Date: 7/31/2026 |