|
Download Data (XLS File) |
|
|||||
|
|||||
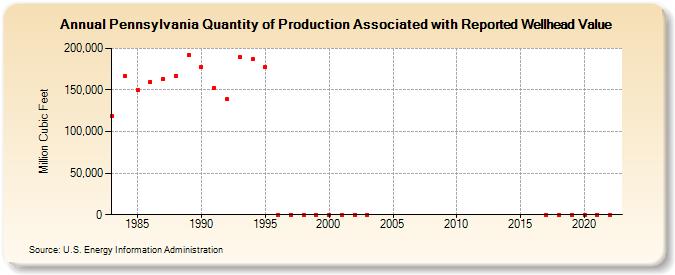
| Pennsylvania Quantity of Production Associated with Reported Wellhead Value (Million Cubic Feet) | |||||
| Decade | Year-0 | Year-1 | Year-2 | Year-3 | Year-4 | Year-5 | Year-6 | Year-7 | Year-8 | Year-9 |
|---|---|---|---|---|---|---|---|---|---|---|
| 1980's | 118,372 | 166,342 | 150,234 | 159,889 | 163,318 | 167,089 | 191,774 | |||
| 1990's | 177,609 | 152,500 | 138,675 | 189,443 | 187,113 | 177,139 | 0 | 0 | 0 | 0 |
| 2000's | 0 | 0 | 0 | 0 | NA | NA | NA | NA | NA | NA |
| 2010's | NA | 0 | 0 | 0 | ||||||
| 2020's | 0 | 0 | 0 | 0 |
| - = No Data Reported; -- = Not Applicable; NA = Not Available; W = Withheld to avoid disclosure of individual company data. |
| Release Date: 6/30/2026 |
| Next Release Date: 7/31/2026 |