|
Download Data (XLS File) |
|
|||||
|
|||||
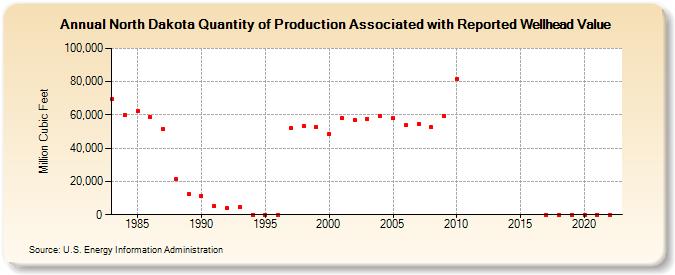
| North Dakota Quantity of Production Associated with Reported Wellhead Value (Million Cubic Feet) | |||||
| Decade | Year-0 | Year-1 | Year-2 | Year-3 | Year-4 | Year-5 | Year-6 | Year-7 | Year-8 | Year-9 |
|---|---|---|---|---|---|---|---|---|---|---|
| 1980's | 69,319 | 60,111 | 62,371 | 58,593 | 51,671 | 21,240 | 12,290 | |||
| 1990's | 11,537 | 5,138 | 3,994 | 4,420 | 0 | 0 | 0 | 52,401 | 53,185 | 52,862 |
| 2000's | 48,714 | 57,949 | 57,015 | 57,808 | 59,513 | 57,972 | 53,675 | 54,745 | 52,469 | 59,369 |
| 2010's | 81,837 | 0 | 0 | 0 | ||||||
| 2020's | 0 | 0 | 0 | 0 |
| - = No Data Reported; -- = Not Applicable; NA = Not Available; W = Withheld to avoid disclosure of individual company data. |
| Release Date: 6/30/2026 |
| Next Release Date: 7/31/2026 |