|
Download Data (XLS File) |
|
|||||
|
|||||
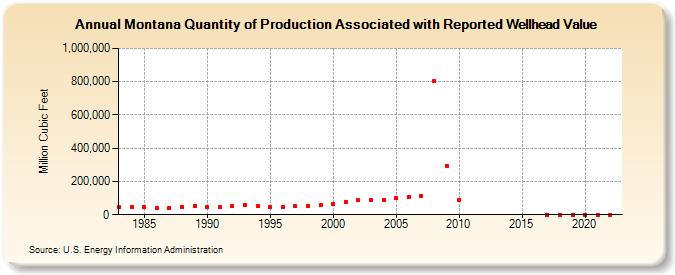
| Montana Quantity of Production Associated with Reported Wellhead Value (Million Cubic Feet) | |||||
| Decade | Year-0 | Year-1 | Year-2 | Year-3 | Year-4 | Year-5 | Year-6 | Year-7 | Year-8 | Year-9 |
|---|---|---|---|---|---|---|---|---|---|---|
| 1980's | 47,751 | 47,534 | 46,113 | 42,203 | 42,814 | 47,748 | 52,044 | |||
| 1990's | 45,998 | 48,075 | 50,359 | 58,810 | 51,953 | 46,739 | 46,868 | 50,409 | 51,967 | 55,780 |
| 2000's | 67,294 | 78,493 | 86,075 | 86,027 | 90,771 | 101,666 | 106,843 | 110,942 | 802,619 | 293,941 |
| 2010's | 87,539 | 0 | 0 | 0 | ||||||
| 2020's | 0 | 0 | 0 | 0 |
| - = No Data Reported; -- = Not Applicable; NA = Not Available; W = Withheld to avoid disclosure of individual company data. |
| Release Date: 6/30/2026 |
| Next Release Date: 7/31/2026 |