|
Download Data (XLS File) |
|
|||||
|
|||||
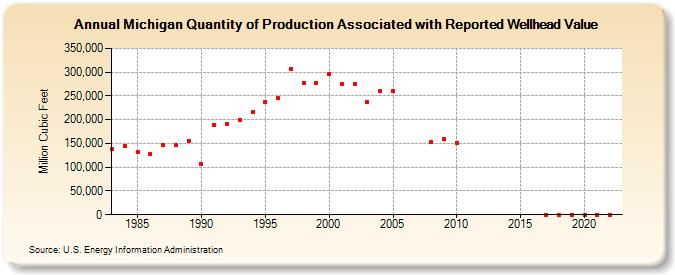
| Michigan Quantity of Production Associated with Reported Wellhead Value (Million Cubic Feet) | |||||
| Decade | Year-0 | Year-1 | Year-2 | Year-3 | Year-4 | Year-5 | Year-6 | Year-7 | Year-8 | Year-9 |
|---|---|---|---|---|---|---|---|---|---|---|
| 1980's | 138,910 | 144,537 | 131,855 | 127,287 | 146,996 | 146,145 | 155,988 | |||
| 1990's | 106,193 | 189,497 | 190,637 | 199,746 | 216,268 | 238,203 | 245,740 | 305,950 | 278,076 | 277,364 |
| 2000's | 296,556 | 275,036 | 274,476 | 236,987 | 259,681 | 261,112 | NA | NA | 153,130 | 159,400 |
| 2010's | 151,886 | 0 | 0 | 0 | ||||||
| 2020's | 0 | 0 | 0 | 0 |
| - = No Data Reported; -- = Not Applicable; NA = Not Available; W = Withheld to avoid disclosure of individual company data. |
| Release Date: 6/30/2026 |
| Next Release Date: 7/31/2026 |