|
Download Data (XLS File) |
|
|||||
|
|||||
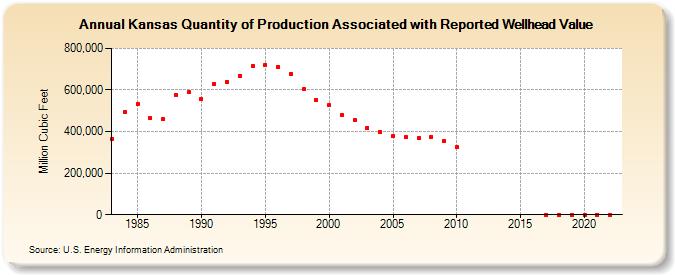
| Kansas Quantity of Production Associated with Reported Wellhead Value (Million Cubic Feet) | |||||
| Decade | Year-0 | Year-1 | Year-2 | Year-3 | Year-4 | Year-5 | Year-6 | Year-7 | Year-8 | Year-9 |
|---|---|---|---|---|---|---|---|---|---|---|
| 1980's | 366,189 | 494,641 | 532,092 | 465,695 | 458,426 | 577,815 | 588,757 | |||
| 1990's | 555,187 | 630,155 | 640,583 | 668,640 | 714,659 | 721,436 | 712,796 | 678,652 | 603,586 | 553,419 |
| 2000's | 525,430 | 480,145 | 454,901 | 418,893 | 397,121 | 377,229 | 372,029 | 366,859 | 375,314 | 355,675 |
| 2010's | 325,591 | 0 | 0 | 0 | ||||||
| 2020's | 0 | 0 | 0 | 0 |
| - = No Data Reported; -- = Not Applicable; NA = Not Available; W = Withheld to avoid disclosure of individual company data. |
| Release Date: 6/30/2026 |
| Next Release Date: 7/31/2026 |