|
Download Data (XLS File) |
|
|||||
|
|||||
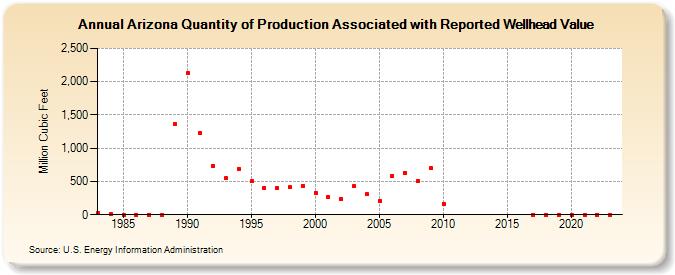
| Arizona Quantity of Production Associated with Reported Wellhead Value (Million Cubic Feet) | |||||
| Decade | Year-0 | Year-1 | Year-2 | Year-3 | Year-4 | Year-5 | Year-6 | Year-7 | Year-8 | Year-9 |
|---|---|---|---|---|---|---|---|---|---|---|
| 1980's | 26 | 10 | 0 | 0 | 0 | 0 | 1,360 | |||
| 1990's | 2,125 | 1,225 | 730 | 548 | 691 | 500 | 405 | 401 | 411 | 439 |
| 2000's | 332 | 266 | 243 | 426 | 306 | 211 | 588 | 634 | 503 | 695 |
| 2010's | 165 | 0 | 0 | 0 | ||||||
| 2020's | 0 | 0 | 0 | 0 |
| - = No Data Reported; -- = Not Applicable; NA = Not Available; W = Withheld to avoid disclosure of individual company data. |
| Release Date: 6/30/2026 |
| Next Release Date: 7/31/2026 |