|
Download Data (XLS File) |
|
|||||
|
|||||
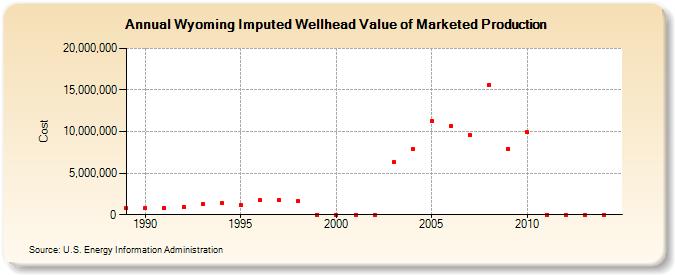
| Wyoming Imputed Wellhead Value of Marketed Production (Cost) | |||||
| Decade | Year-0 | Year-1 | Year-2 | Year-3 | Year-4 | Year-5 | Year-6 | Year-7 | Year-8 | Year-9 |
|---|---|---|---|---|---|---|---|---|---|---|
| 1980's | 822,598 | |||||||||
| 1990's | 855,505 | 823,120 | 952,111 | 1,262,675 | 1,429,163 | 1,197,513 | 1,714,837 | 1,789,760 | 1,604,851 | 0 |
| 2000's | 0 | 0 | 0 | 6,361,665 | 7,893,121 | 11,245,109 | 10,626,810 | 9,531,682 | 15,614,025 | 7,946,889 |
| 2010's | 9,913,756 | 0 | 0 | 0 | 0 |
| - = No Data Reported; -- = Not Applicable; NA = Not Available; W = Withheld to avoid disclosure of individual company data. |
| Release Date: 6/30/2026 |
| Next Release Date: 7/31/2026 |