|
Download Data (XLS File) |
|
|||||
|
|||||
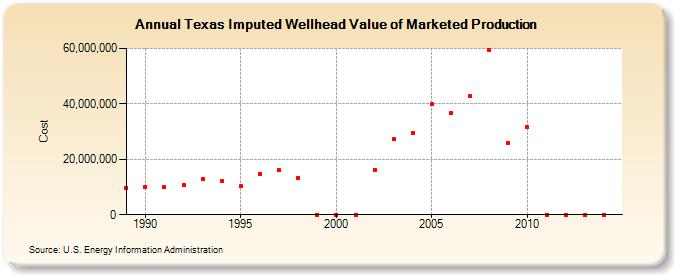
| Texas Imputed Wellhead Value of Marketed Production (Cost) | |||||
| Decade | Year-0 | Year-1 | Year-2 | Year-3 | Year-4 | Year-5 | Year-6 | Year-7 | Year-8 | Year-9 |
|---|---|---|---|---|---|---|---|---|---|---|
| 1980's | 9,570,664 | |||||||||
| 1990's | 9,939,202 | 9,986,239 | 10,878,176 | 13,058,965 | 11,985,129 | 10,208,278 | 14,817,786 | 15,975,789 | 13,187,617 | 0 |
| 2000's | 0 | 0 | 16,258,187 | 27,171,116 | 29,560,687 | 39,812,981 | 36,591,424 | 42,733,613 | 59,242,316 | 25,956,559 |
| 2010's | 31,535,019 | 0 | 0 | 0 | 0 |
| - = No Data Reported; -- = Not Applicable; NA = Not Available; W = Withheld to avoid disclosure of individual company data. |
| Release Date: 6/30/2026 |
| Next Release Date: 7/31/2026 |