|
Download Data (XLS File) |
|
|||||
|
|||||
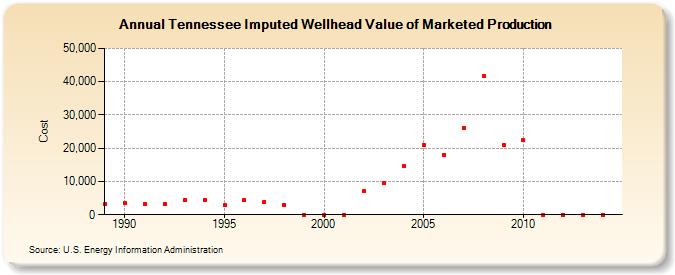
| Tennessee Imputed Wellhead Value of Marketed Production (Cost) | |||||
| Decade | Year-0 | Year-1 | Year-2 | Year-3 | Year-4 | Year-5 | Year-6 | Year-7 | Year-8 | Year-9 |
|---|---|---|---|---|---|---|---|---|---|---|
| 1980's | 3,135 | |||||||||
| 1990's | 3,410 | 3,192 | 3,168 | 4,400 | 4,300 | 2,800 | 4,300 | 3,850 | 3,060 | 0 |
| 2000's | 0 | 0 | 7,000 | 9,412 | 14,500 | 21,000 | 18,052 | 26,134 | 41,595 | 21,000 |
| 2010's | 22,384 | 0 | 0 | 0 | 0 |
| - = No Data Reported; -- = Not Applicable; NA = Not Available; W = Withheld to avoid disclosure of individual company data. |
| Release Date: 6/30/2026 |
| Next Release Date: 7/31/2026 |