|
Download Data (XLS File) |
|
|||||
|
|||||
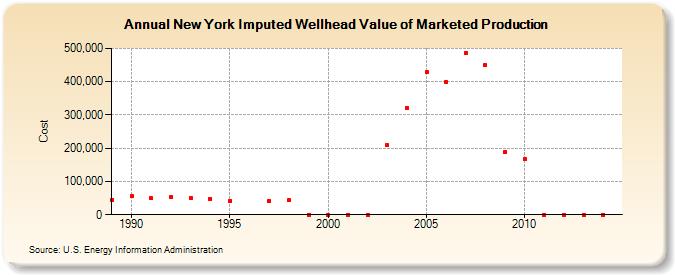
| New York Imputed Wellhead Value of Marketed Production (Cost) | |||||
| Decade | Year-0 | Year-1 | Year-2 | Year-3 | Year-4 | Year-5 | Year-6 | Year-7 | Year-8 | Year-9 |
|---|---|---|---|---|---|---|---|---|---|---|
| 1980's | 44,953 | |||||||||
| 1990's | 55,050 | 48,971 | 52,893 | 50,839 | 48,093 | 42,319 | 41,481 | 42,791 | 0 | |
| 2000's | 0 | 0 | 0 | 208,874 | 321,428 | 429,300 | 399,137 | 486,238 | 449,861 | 188,814 |
| 2010's | 166,532 | 0 | 0 | 0 | 0 |
| - = No Data Reported; -- = Not Applicable; NA = Not Available; W = Withheld to avoid disclosure of individual company data. |
| Release Date: 6/30/2026 |
| Next Release Date: 7/31/2026 |