|
Download Data (XLS File) |
|
|||||
|
|||||
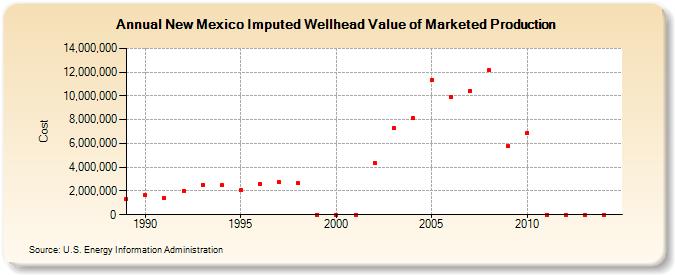
| New Mexico Imputed Wellhead Value of Marketed Production (Cost) | |||||
| Decade | Year-0 | Year-1 | Year-2 | Year-3 | Year-4 | Year-5 | Year-6 | Year-7 | Year-8 | Year-9 |
|---|---|---|---|---|---|---|---|---|---|---|
| 1980's | 1,337,002 | |||||||||
| 1990's | 1,629,289 | 1,422,450 | 2,030,181 | 2,525,499 | 2,463,313 | 2,056,148 | 2,588,984 | 2,750,442 | 2,648,913 | 0 |
| 2000's | 0 | 0 | 4,379,508 | 7,306,627 | 8,118,928 | 11,368,592 | 9,946,943 | 10,448,192 | 12,146,320 | 5,762,136 |
| 2010's | 6,878,560 | 0 | 0 | 0 | 0 |
| - = No Data Reported; -- = Not Applicable; NA = Not Available; W = Withheld to avoid disclosure of individual company data. |
| Release Date: 6/30/2026 |
| Next Release Date: 7/31/2026 |