|
Download Data (XLS File) |
|
|||||
|
|||||
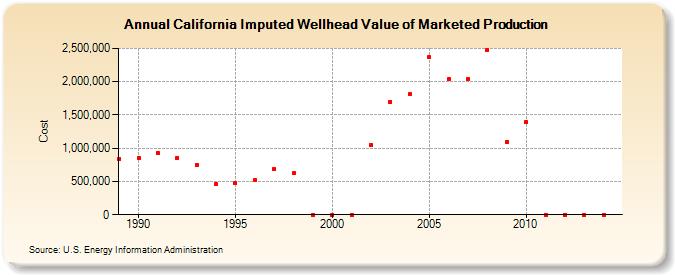
| California Imputed Wellhead Value of Marketed Production (Cost) | |||||
| Decade | Year-0 | Year-1 | Year-2 | Year-3 | Year-4 | Year-5 | Year-6 | Year-7 | Year-8 | Year-9 |
|---|---|---|---|---|---|---|---|---|---|---|
| 1980's | 841,414 | |||||||||
| 1990's | 857,406 | 930,825 | 855,579 | 752,605 | 463,234 | 483,258 | 521,448 | 687,367 | 621,446 | 0 |
| 2000's | 0 | 0 | 1,051,797 | 1,698,195 | 1,807,720 | 2,365,347 | 2,038,915 | 2,033,054 | 2,483,126 | 1,095,181 |
| 2010's | 1,396,916 | 0 | 0 | 0 | 0 |
| - = No Data Reported; -- = Not Applicable; NA = Not Available; W = Withheld to avoid disclosure of individual company data. |
| Release Date: 6/30/2026 |
| Next Release Date: 7/31/2026 |