|
Download Data (XLS File) |
|
|||||
|
|||||
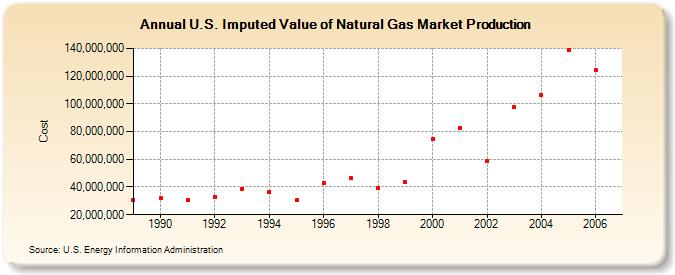
| U.S. Imputed Value of Natural Gas Market Production (Cost) | |||||
| Decade | Year-0 | Year-1 | Year-2 | Year-3 | Year-4 | Year-5 | Year-6 | Year-7 | Year-8 | Year-9 |
|---|---|---|---|---|---|---|---|---|---|---|
| 1980's | 30,524,691 | |||||||||
| 1990's | 31,754,803 | 30,327,779 | 32,570,827 | 38,810,612 | 36,535,940 | 30,285,862 | 42,951,353 | 46,131,323 | 39,085,318 | 43,324,690 |
| 2000's | 74,338,958 | 82,202,805 | 58,596,868 | 97,555,375 | 106,521,974 | 138,750,746 | 124,074,399 |
| - = No Data Reported; -- = Not Applicable; NA = Not Available; W = Withheld to avoid disclosure of individual company data. |
| Release Date: 6/30/2026 |
| Next Release Date: 7/31/2026 |