|
Download Data (XLS File) |
|
|||||
|
|||||
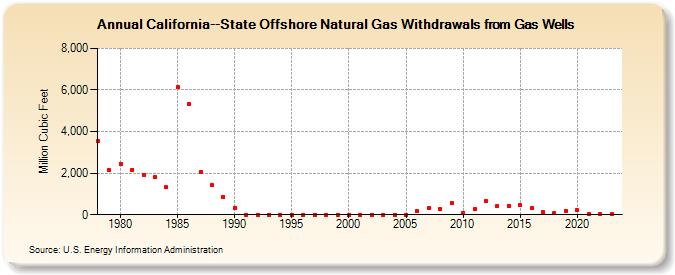
| California--State Offshore Natural Gas Withdrawals from Gas Wells (Million Cubic Feet) | |||||
| Decade | Year-0 | Year-1 | Year-2 | Year-3 | Year-4 | Year-5 | Year-6 | Year-7 | Year-8 | Year-9 |
|---|---|---|---|---|---|---|---|---|---|---|
| 1970's | 3,537 | 2,134 | ||||||||
| 1980's | 2,446 | 2,170 | 1,931 | 1,799 | 1,319 | 6,126 | 5,342 | 2,068 | 1,413 | 855 |
| 1990's | 340 | 0 | 0 | 0 | 0 | 0 | 0 | 0 | 0 | 0 |
| 2000's | 0 | 0 | 0 | 0 | 0 | 0 | 156 | 312 | 266 | 582 |
| 2010's | 71 | 259 | 640 | 413 | 410 | 452 | 305 | 115 | 70 | 191 |
| 2020's | 210 | 32 | 34 | 42 | 38 |
| - = No Data Reported; -- = Not Applicable; NA = Not Available; W = Withheld to avoid disclosure of individual company data. |
| Release Date: 6/30/2026 |
| Next Release Date: 7/31/2026 |