|
Download Data (XLS File) |
|
||||||||
|
||||||||
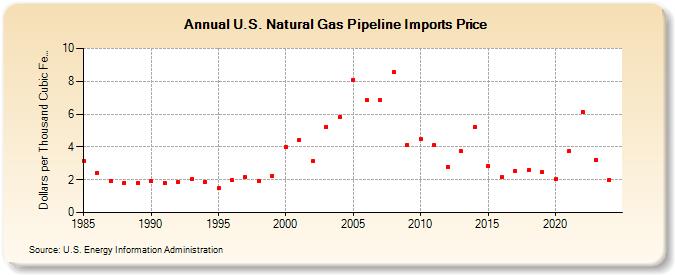
| U.S. Natural Gas Pipeline Imports Price (Dollars per Thousand Cubic Feet) | ||||||||
| Decade | Year-0 | Year-1 | Year-2 | Year-3 | Year-4 | Year-5 | Year-6 | Year-7 | Year-8 | Year-9 |
|---|---|---|---|---|---|---|---|---|---|---|
| 1980's | 3.17 | 2.42 | 1.95 | 1.83 | 1.81 | |||||
| 1990's | 1.91 | 1.81 | 1.84 | 2.02 | 1.86 | 1.48 | 1.96 | 2.15 | 1.95 | 2.23 |
| 2000's | 3.98 | 4.44 | 3.13 | 5.23 | 5.80 | 8.09 | 6.83 | 6.83 | 8.57 | 4.13 |
| 2010's | 4.46 | 4.09 | 2.79 | 3.73 | 5.21 | 2.84 | 2.18 | 2.55 | 2.58 | 2.46 |
| 2020's | 2.02 | 3.72 | 6.15 | 3.23 | 2.01 | 2.85 |
| - = No Data Reported; -- = Not Applicable; NA = Not Available; W = Withheld to avoid disclosure of individual company data. |
| Release Date: 6/30/2026 |
| Next Release Date: 7/31/2026 |