|
Download Data (XLS File) |
|
||||||||
|
||||||||
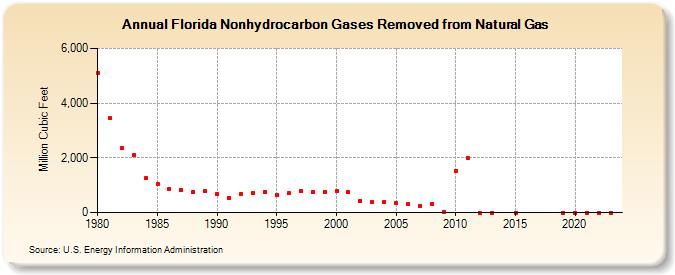
| Florida Nonhydrocarbon Gases Removed from Natural Gas (Million Cubic Feet) | ||||||||
| Decade | Year-0 | Year-1 | Year-2 | Year-3 | Year-4 | Year-5 | Year-6 | Year-7 | Year-8 | Year-9 |
|---|---|---|---|---|---|---|---|---|---|---|
| 1980's | 5,106 | 3,468 | 2,353 | 2,103 | 1,248 | 1,045 | 879 | 822 | 757 | 790 |
| 1990's | 681 | 531 | 682 | 721 | 762 | 642 | 700 | 793 | 751 | 769 |
| 2000's | 788 | 736 | 431 | 387 | 402 | 337 | 304 | 222 | 306 | 32 |
| 2010's | 1,529 | 2,004 | 0 | 0 | NA | 0 | NA | NA | NA | 0 |
| 2020's | 0 | 0 | 0 | 0 | 0 |
| - = No Data Reported; -- = Not Applicable; NA = Not Available; W = Withheld to avoid disclosure of individual company data. |
| Release Date: 6/30/2026 |
| Next Release Date: 7/31/2026 |