|
Download Data (XLS File) |
|
||||||||
|
||||||||
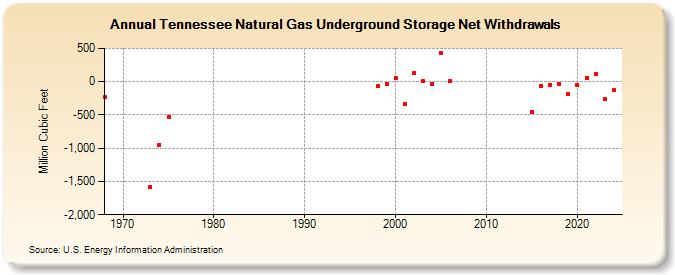
| Tennessee Natural Gas Underground Storage Net Withdrawals (Million Cubic Feet) | ||||||||
| Decade | Year-0 | Year-1 | Year-2 | Year-3 | Year-4 | Year-5 | Year-6 | Year-7 | Year-8 | Year-9 |
|---|---|---|---|---|---|---|---|---|---|---|
| 1960's | -234 | |||||||||
| 1970's | -1,580 | -946 | -528 | |||||||
| 1990's | -62 | -34 | ||||||||
| 2000's | 59 | -337 | 131 | 9 | -42 | 426 | 16 | |||
| 2010's | -453 | -66 | -45 | -35 | -179 | |||||
| 2020's | -57 | 53 | 110 | -260 | -132 | 25 |
| - = No Data Reported; -- = Not Applicable; NA = Not Available; W = Withheld to avoid disclosure of individual company data. |
| Release Date: 6/30/2026 |
| Next Release Date: 7/31/2026 |