|
Download Data (XLS File) |
|
||||||||
|
||||||||
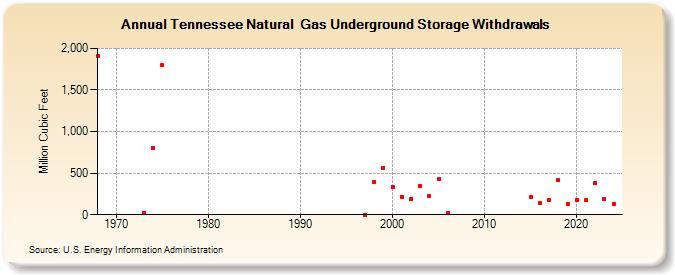
| Tennessee Natural Gas Underground Storage Withdrawals (Million Cubic Feet) | ||||||||
| Decade | Year-0 | Year-1 | Year-2 | Year-3 | Year-4 | Year-5 | Year-6 | Year-7 | Year-8 | Year-9 |
|---|---|---|---|---|---|---|---|---|---|---|
| 1960's | 1,906 | |||||||||
| 1970's | 26 | 804 | 1,797 | |||||||
| 1990's | 0 | 391 | 565 | |||||||
| 2000's | 332 | 219 | 194 | 344 | 220 | 426 | 16 | |||
| 2010's | 212 | 139 | 178 | 417 | 132 | |||||
| 2020's | 174 | 176 | 385 | 193 | 132 | 212 |
| - = No Data Reported; -- = Not Applicable; NA = Not Available; W = Withheld to avoid disclosure of individual company data. |
| Release Date: 6/30/2026 |
| Next Release Date: 7/31/2026 |