|
Download Data (XLS File) |
|
||||||||
|
||||||||
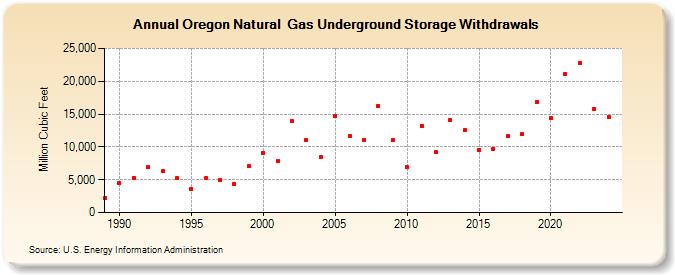
| Oregon Natural Gas Underground Storage Withdrawals (Million Cubic Feet) | ||||||||
| Decade | Year-0 | Year-1 | Year-2 | Year-3 | Year-4 | Year-5 | Year-6 | Year-7 | Year-8 | Year-9 |
|---|---|---|---|---|---|---|---|---|---|---|
| 1980's | 2,223 | |||||||||
| 1990's | 4,531 | 5,288 | 6,985 | 6,302 | 5,237 | 3,567 | 5,199 | 4,943 | 4,395 | 7,017 |
| 2000's | 9,104 | 7,868 | 13,894 | 10,980 | 8,394 | 14,664 | 11,699 | 11,069 | 16,232 | 10,999 |
| 2010's | 6,871 | 13,247 | 9,195 | 14,114 | 12,540 | 9,536 | 9,648 | 11,657 | 11,888 | 16,830 |
| 2020's | 14,354 | 21,120 | 22,794 | 15,814 | 14,519 | 18,284 |
| - = No Data Reported; -- = Not Applicable; NA = Not Available; W = Withheld to avoid disclosure of individual company data. |
| Release Date: 6/30/2026 |
| Next Release Date: 7/31/2026 |