|
Download Data (XLS File) |
|
||||||||
|
||||||||
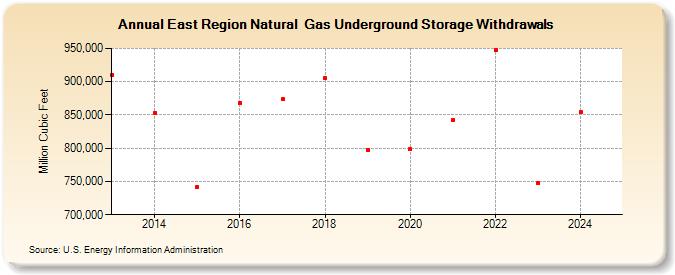
| East Region Natural Gas Underground Storage Withdrawals (Million Cubic Feet) | ||||||||
| Decade | Year-0 | Year-1 | Year-2 | Year-3 | Year-4 | Year-5 | Year-6 | Year-7 | Year-8 | Year-9 |
|---|---|---|---|---|---|---|---|---|---|---|
| 2010's | 909,835 | 852,926 | 741,957 | 867,703 | 873,843 | 905,007 | 797,685 | |||
| 2020's | 798,615 | 842,742 | 947,475 | 748,110 | 853,639 | 908,307 |
| - = No Data Reported; -- = Not Applicable; NA = Not Available; W = Withheld to avoid disclosure of individual company data. |
| Release Date: 6/30/2026 |
| Next Release Date: 7/31/2026 |