|
Download Data (XLS File) |
|
||||||||
|
||||||||
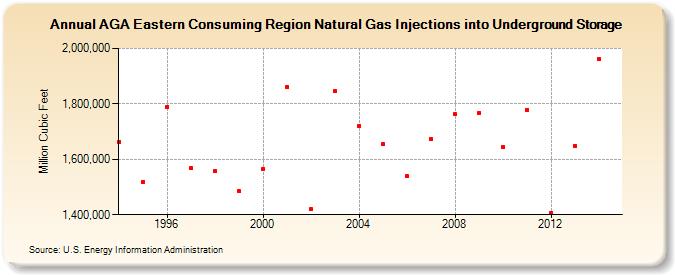
| AGA Eastern Consuming Region Natural Gas Injections into Underground Storage (Million Cubic Feet) | ||||||||
| Decade | Year-0 | Year-1 | Year-2 | Year-3 | Year-4 | Year-5 | Year-6 | Year-7 | Year-8 | Year-9 |
|---|---|---|---|---|---|---|---|---|---|---|
| 1990's | 1,663,263 | 1,518,707 | 1,789,896 | 1,567,865 | 1,556,473 | 1,484,242 | ||||
| 2000's | 1,566,681 | 1,860,997 | 1,420,200 | 1,845,171 | 1,720,353 | 1,654,715 | 1,537,923 | 1,672,984 | 1,762,266 | 1,767,863 |
| 2010's | 1,644,865 | 1,778,666 | 1,405,381 | 1,648,362 | 1,960,918 |
| - = No Data Reported; -- = Not Applicable; NA = Not Available; W = Withheld to avoid disclosure of individual company data. |
| Release Date: 6/30/2026 |
| Next Release Date: 7/31/2026 |