|
Download Data (XLS File) |
|
||||||||
|
||||||||
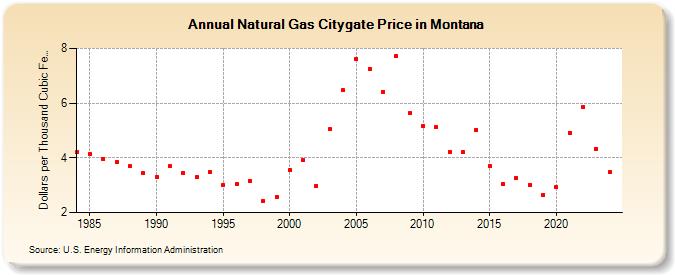
| Natural Gas Citygate Price in Montana (Dollars per Thousand Cubic Feet) | ||||||||
| Decade | Year-0 | Year-1 | Year-2 | Year-3 | Year-4 | Year-5 | Year-6 | Year-7 | Year-8 | Year-9 |
|---|---|---|---|---|---|---|---|---|---|---|
| 1980's | 4.21 | 4.14 | 3.94 | 3.85 | 3.69 | 3.43 | ||||
| 1990's | 3.30 | 3.69 | 3.45 | 3.29 | 3.49 | 3.01 | 3.03 | 3.16 | 2.43 | 2.57 |
| 2000's | 3.55 | 3.93 | 2.98 | 5.04 | 6.47 | 7.62 | 7.25 | 6.42 | 7.71 | 5.63 |
| 2010's | 5.17 | 5.11 | 4.23 | 4.21 | 5.03 | 3.71 | 3.05 | 3.28 | 3.02 | 2.66 |
| 2020's | 2.92 | 4.92 | 5.87 | 4.34 | 3.48 | 3.36 |
| - = No Data Reported; -- = Not Applicable; NA = Not Available; W = Withheld to avoid disclosure of individual company data. |
| Release Date: 6/30/2026 |
| Next Release Date: 7/31/2026 |