|
Download Data (XLS File) |
|
||||||||
|
||||||||
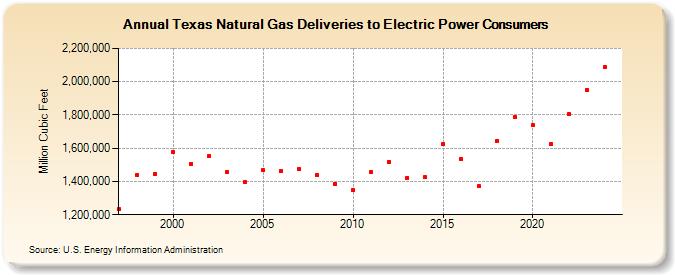
| Texas Natural Gas Deliveries to Electric Power Consumers (Million Cubic Feet) | ||||||||
| Decade | Year-0 | Year-1 | Year-2 | Year-3 | Year-4 | Year-5 | Year-6 | Year-7 | Year-8 | Year-9 |
|---|---|---|---|---|---|---|---|---|---|---|
| 1990's | 1,231,541 | 1,440,704 | 1,444,716 | |||||||
| 2000's | 1,577,563 | 1,506,112 | 1,550,292 | 1,453,858 | 1,394,408 | 1,466,263 | 1,463,658 | 1,473,555 | 1,440,043 | 1,387,421 |
| 2010's | 1,348,656 | 1,454,413 | 1,516,946 | 1,422,600 | 1,425,134 | 1,623,836 | 1,534,063 | 1,370,474 | 1,643,854 | 1,787,199 |
| 2020's | 1,738,761 | 1,626,481 | 1,805,335 | 2,017,984 | 2,121,502 | 2,077,381 |
| - = No Data Reported; -- = Not Applicable; NA = Not Available; W = Withheld to avoid disclosure of individual company data. |
| Release Date: 6/30/2026 |
| Next Release Date: 7/31/2026 |