|
Download Data (XLS File) |
|
||||||||
|
||||||||
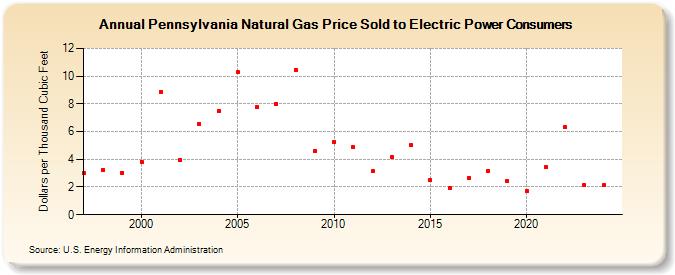
| Pennsylvania Natural Gas Price Sold to Electric Power Consumers (Dollars per Thousand Cubic Feet) | ||||||||
| Decade | Year-0 | Year-1 | Year-2 | Year-3 | Year-4 | Year-5 | Year-6 | Year-7 | Year-8 | Year-9 |
|---|---|---|---|---|---|---|---|---|---|---|
| 1990's | 3.02 | 3.26 | 3.03 | |||||||
| 2000's | 3.83 | 8.87 | 3.97 | 6.58 | 7.49 | 10.30 | 7.76 | 8.01 | 10.46 | 4.60 |
| 2010's | 5.27 | 4.85 | 3.15 | 4.17 | 5.04 | 2.52 | 1.94 | 2.65 | 3.17 | 2.43 |
| 2020's | 1.69 | 3.43 | 6.31 | 2.16 | 2.11 | 3.39 |
| - = No Data Reported; -- = Not Applicable; NA = Not Available; W = Withheld to avoid disclosure of individual company data. |
| Release Date: 6/30/2026 |
| Next Release Date: 7/31/2026 |