|
Download Data (XLS File) |
|
||||||||
|
||||||||
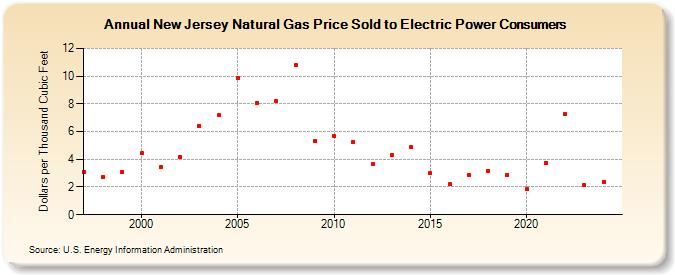
| New Jersey Natural Gas Price Sold to Electric Power Consumers (Dollars per Thousand Cubic Feet) | ||||||||
| Decade | Year-0 | Year-1 | Year-2 | Year-3 | Year-4 | Year-5 | Year-6 | Year-7 | Year-8 | Year-9 |
|---|---|---|---|---|---|---|---|---|---|---|
| 1990's | 3.06 | 2.74 | 3.08 | |||||||
| 2000's | 4.42 | 3.43 | 4.19 | 6.43 | 7.17 | 9.88 | 8.06 | 8.17 | 10.78 | 5.31 |
| 2010's | 5.66 | 5.24 | 3.63 | 4.34 | 4.86 | 2.98 | 2.20 | 2.83 | 3.18 | 2.89 |
| 2020's | 1.85 | 3.75 | 7.24 | 2.14 | 2.42 | 4.15 |
| - = No Data Reported; -- = Not Applicable; NA = Not Available; W = Withheld to avoid disclosure of individual company data. |
| Release Date: 6/30/2026 |
| Next Release Date: 7/31/2026 |