|
Download Data (XLS File) |
|
||||||||
|
||||||||
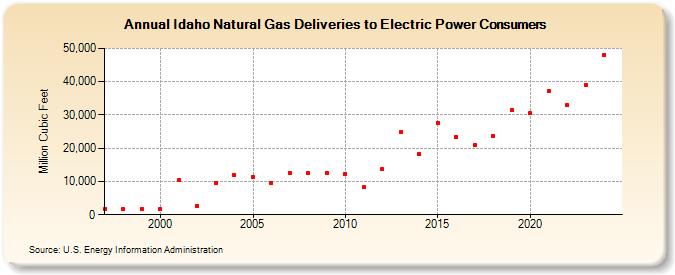
| Idaho Natural Gas Deliveries to Electric Power Consumers (Million Cubic Feet) | ||||||||
| Decade | Year-0 | Year-1 | Year-2 | Year-3 | Year-4 | Year-5 | Year-6 | Year-7 | Year-8 | Year-9 |
|---|---|---|---|---|---|---|---|---|---|---|
| 1990's | 1,781 | 1,769 | 1,749 | |||||||
| 2000's | 1,712 | 10,479 | 2,720 | 9,596 | 11,892 | 11,425 | 9,611 | 12,504 | 12,530 | 12,575 |
| 2010's | 12,375 | 8,299 | 13,599 | 24,860 | 18,370 | 27,710 | 23,311 | 20,924 | 23,683 | 31,409 |
| 2020's | 30,491 | 37,286 | 32,855 | 46,356 | 52,957 | 49,330 |
| - = No Data Reported; -- = Not Applicable; NA = Not Available; W = Withheld to avoid disclosure of individual company data. |
| Release Date: 6/30/2026 |
| Next Release Date: 7/31/2026 |