|
Download Data (XLS File) |
|
||||||||
|
||||||||
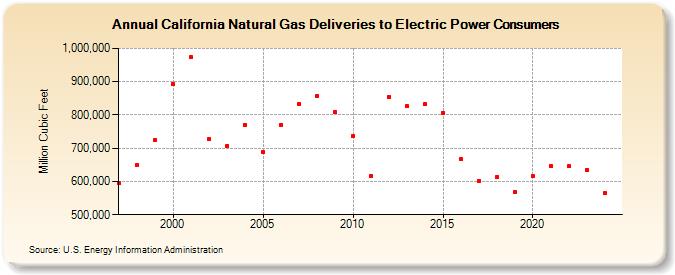
| California Natural Gas Deliveries to Electric Power Consumers (Million Cubic Feet) | ||||||||
| Decade | Year-0 | Year-1 | Year-2 | Year-3 | Year-4 | Year-5 | Year-6 | Year-7 | Year-8 | Year-9 |
|---|---|---|---|---|---|---|---|---|---|---|
| 1990's | 595,822 | 649,087 | 723,171 | |||||||
| 2000's | 893,377 | 973,327 | 726,627 | 705,343 | 770,517 | 689,169 | 770,836 | 834,286 | 857,867 | 808,928 |
| 2010's | 736,092 | 616,564 | 855,342 | 825,713 | 831,522 | 805,933 | 666,017 | 600,988 | 614,722 | 568,341 |
| 2020's | 616,256 | 646,082 | 645,344 | 633,057 | 566,863 | 473,610 |
| - = No Data Reported; -- = Not Applicable; NA = Not Available; W = Withheld to avoid disclosure of individual company data. |
| Release Date: 6/30/2026 |
| Next Release Date: 7/31/2026 |