|
Download Data (XLS File) |
|
||||||||
|
||||||||
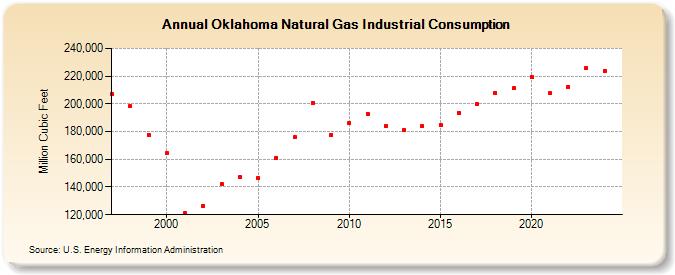
| Oklahoma Natural Gas Industrial Consumption (Million Cubic Feet) | ||||||||
| Decade | Year-0 | Year-1 | Year-2 | Year-3 | Year-4 | Year-5 | Year-6 | Year-7 | Year-8 | Year-9 |
|---|---|---|---|---|---|---|---|---|---|---|
| 1990's | 206,769 | 198,105 | 177,786 | |||||||
| 2000's | 164,229 | 120,901 | 126,204 | 142,315 | 146,977 | 146,593 | 161,231 | 175,882 | 200,828 | 177,521 |
| 2010's | 185,909 | 193,001 | 184,005 | 180,809 | 183,874 | 184,547 | 193,703 | 199,576 | 207,901 | 211,168 |
| 2020's | 219,708 | 207,511 | 212,415 | 225,832 | 224,269 | 219,923 |
| - = No Data Reported; -- = Not Applicable; NA = Not Available; W = Withheld to avoid disclosure of individual company data. |
| Release Date: 6/30/2026 |
| Next Release Date: 7/31/2026 |