|
Download Data (XLS File) |
|
||||||||
|
||||||||
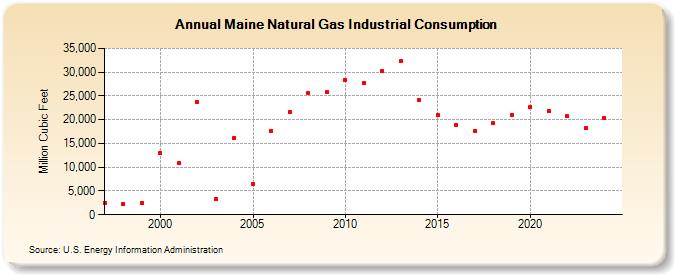
| Maine Natural Gas Industrial Consumption (Million Cubic Feet) | ||||||||
| Decade | Year-0 | Year-1 | Year-2 | Year-3 | Year-4 | Year-5 | Year-6 | Year-7 | Year-8 | Year-9 |
|---|---|---|---|---|---|---|---|---|---|---|
| 1990's | 2,525 | 2,297 | 2,550 | |||||||
| 2000's | 12,984 | 10,929 | 23,672 | 3,315 | 16,233 | 6,500 | 17,514 | 21,640 | 25,628 | 25,923 |
| 2010's | 28,365 | 27,734 | 30,248 | 32,308 | 24,121 | 20,972 | 18,983 | 17,698 | 19,231 | 21,024 |
| 2020's | 22,679 | 21,863 | 20,668 | 18,325 | 19,985 | 20,434 |
| - = No Data Reported; -- = Not Applicable; NA = Not Available; W = Withheld to avoid disclosure of individual company data. |
| Release Date: 6/30/2026 |
| Next Release Date: 7/31/2026 |