|
Download Data (XLS File) |
|
||||||||
|
||||||||
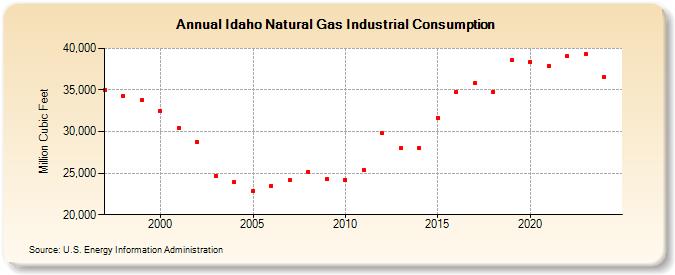
| Idaho Natural Gas Industrial Consumption (Million Cubic Feet) | ||||||||
| Decade | Year-0 | Year-1 | Year-2 | Year-3 | Year-4 | Year-5 | Year-6 | Year-7 | Year-8 | Year-9 |
|---|---|---|---|---|---|---|---|---|---|---|
| 1990's | 34,999 | 34,303 | 33,846 | |||||||
| 2000's | 32,464 | 30,435 | 28,729 | 24,689 | 23,907 | 22,852 | 23,488 | 24,119 | 25,191 | 24,256 |
| 2010's | 24,195 | 25,392 | 29,781 | 27,996 | 28,046 | 31,664 | 34,761 | 35,856 | 34,761 | 38,598 |
| 2020's | 38,390 | 37,888 | 39,071 | 39,338 | 36,548 | 33,093 |
| - = No Data Reported; -- = Not Applicable; NA = Not Available; W = Withheld to avoid disclosure of individual company data. |
| Release Date: 6/30/2026 |
| Next Release Date: 7/31/2026 |