|
Download Data (XLS File) |
|
||||||||
|
||||||||
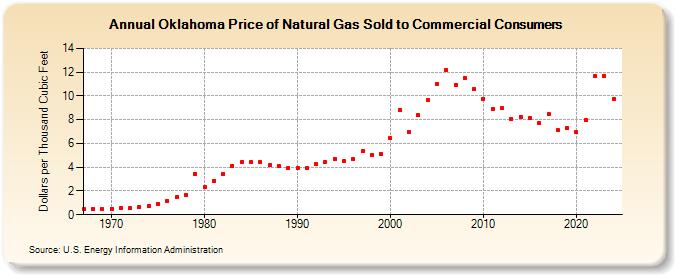
| Oklahoma Price of Natural Gas Sold to Commercial Consumers (Dollars per Thousand Cubic Feet) | ||||||||
| Decade | Year-0 | Year-1 | Year-2 | Year-3 | Year-4 | Year-5 | Year-6 | Year-7 | Year-8 | Year-9 |
|---|---|---|---|---|---|---|---|---|---|---|
| 1960's | 0.48 | 0.47 | 0.50 | |||||||
| 1970's | 0.52 | 0.53 | 0.56 | 0.64 | 0.75 | 0.94 | 1.17 | 1.52 | 1.68 | 3.42 |
| 1980's | 2.30 | 2.86 | 3.45 | 4.13 | 4.42 | 4.41 | 4.41 | 4.18 | 4.07 | 3.94 |
| 1990's | 3.92 | 3.91 | 4.23 | 4.42 | 4.73 | 4.48 | 4.71 | 5.34 | 5.05 | 5.09 |
| 2000's | 6.43 | 8.83 | 6.96 | 8.38 | 9.63 | 11.01 | 12.17 | 10.94 | 11.54 | 10.59 |
| 2010's | 9.77 | 8.94 | 8.95 | 8.05 | 8.25 | 8.12 | 7.72 | 8.44 | 7.09 | 7.28 |
| 2020's | 6.94 | 7.98 | 11.67 | 11.53 | 9.83 | 10.34 |
| - = No Data Reported; -- = Not Applicable; NA = Not Available; W = Withheld to avoid disclosure of individual company data. |
| Release Date: 6/30/2026 |
| Next Release Date: 7/31/2026 |
Referring Pages: