|
Download Data (XLS File) |
|
||||||||
|
||||||||
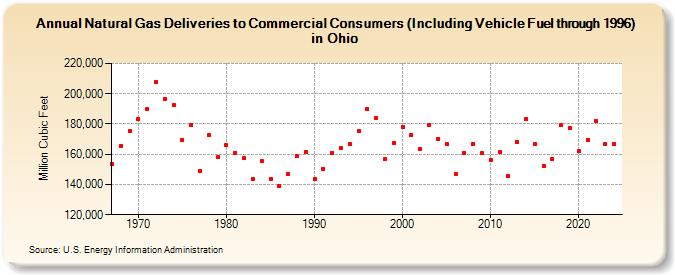
| Natural Gas Deliveries to Commercial Consumers (Including Vehicle Fuel through 1996) in Ohio (Million Cubic Feet) | ||||||||
| Decade | Year-0 | Year-1 | Year-2 | Year-3 | Year-4 | Year-5 | Year-6 | Year-7 | Year-8 | Year-9 |
|---|---|---|---|---|---|---|---|---|---|---|
| 1960's | 153,376 | 165,414 | 175,372 | |||||||
| 1970's | 183,412 | 189,791 | 208,068 | 196,663 | 192,497 | 169,357 | 179,392 | 149,011 | 172,429 | 158,117 |
| 1980's | 166,210 | 161,110 | 157,664 | 143,568 | 155,350 | 143,311 | 139,119 | 146,983 | 158,790 | 161,516 |
| 1990's | 143,503 | 150,339 | 160,645 | 164,044 | 166,798 | 175,160 | 189,966 | 183,838 | 156,630 | 167,573 |
| 2000's | 177,917 | 172,555 | 163,274 | 179,611 | 170,240 | 166,693 | 146,930 | 160,580 | 167,070 | 160,612 |
| 2010's | 156,407 | 161,408 | 145,482 | 168,233 | 183,105 | 166,602 | 152,478 | 156,979 | 178,992 | 177,428 |
| 2020's | 162,029 | 169,448 | 181,674 | 165,358 | 162,089 | 188,843 |
| - = No Data Reported; -- = Not Applicable; NA = Not Available; W = Withheld to avoid disclosure of individual company data. |
| Release Date: 6/30/2026 |
| Next Release Date: 7/31/2026 |