|
Download Data (XLS File) |
|
||||||||
|
||||||||
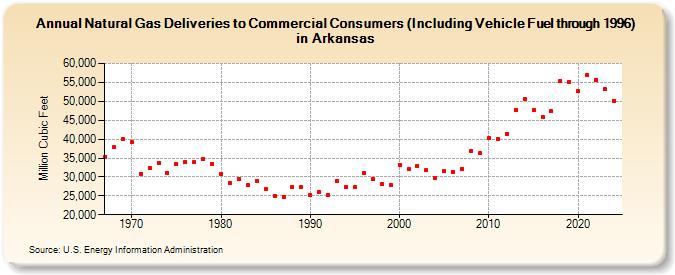
| Natural Gas Deliveries to Commercial Consumers (Including Vehicle Fuel through 1996) in Arkansas (Million Cubic Feet) | ||||||||
| Decade | Year-0 | Year-1 | Year-2 | Year-3 | Year-4 | Year-5 | Year-6 | Year-7 | Year-8 | Year-9 |
|---|---|---|---|---|---|---|---|---|---|---|
| 1960's | 35,295 | 37,886 | 39,962 | |||||||
| 1970's | 39,169 | 30,832 | 32,457 | 33,789 | 31,040 | 33,291 | 34,011 | 33,913 | 34,612 | 33,442 |
| 1980's | 30,690 | 28,282 | 29,438 | 27,739 | 28,995 | 26,731 | 24,949 | 24,603 | 27,457 | 27,271 |
| 1990's | 25,129 | 25,986 | 25,314 | 28,998 | 27,407 | 27,409 | 31,006 | 29,441 | 28,062 | 27,898 |
| 2000's | 33,180 | 32,031 | 32,928 | 31,746 | 29,821 | 31,521 | 31,286 | 32,187 | 36,924 | 36,373 |
| 2010's | 40,232 | 39,986 | 41,435 | 47,636 | 50,673 | 47,651 | 45,810 | 47,496 | 55,453 | 55,100 |
| 2020's | 52,697 | 57,061 | 55,679 | 53,158 | 52,473 | 52,253 |
| - = No Data Reported; -- = Not Applicable; NA = Not Available; W = Withheld to avoid disclosure of individual company data. |
| Release Date: 6/30/2026 |
| Next Release Date: 7/31/2026 |