|
Download Data (XLS File) |
|
||||||||
|
||||||||
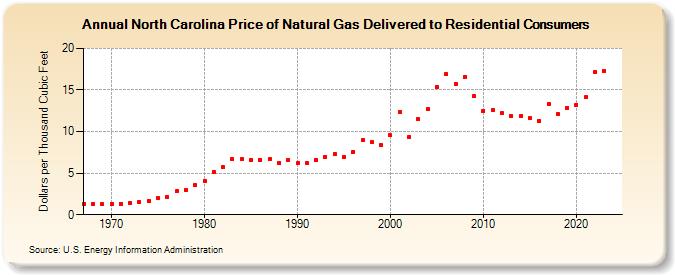
| North Carolina Price of Natural Gas Delivered to Residential Consumers (Dollars per Thousand Cubic Feet) | ||||||||
| Decade | Year-0 | Year-1 | Year-2 | Year-3 | Year-4 | Year-5 | Year-6 | Year-7 | Year-8 | Year-9 |
|---|---|---|---|---|---|---|---|---|---|---|
| 1960's | 1.31 | 1.29 | 1.25 | |||||||
| 1970's | 1.30 | 1.34 | 1.41 | 1.51 | 1.69 | 2.02 | 2.13 | 2.81 | 3.00 | 3.52 |
| 1980's | 4.11 | 5.17 | 5.73 | 6.65 | 6.68 | 6.60 | 6.62 | 6.66 | 6.25 | 6.55 |
| 1990's | 6.17 | 6.24 | 6.60 | 6.99 | 7.30 | 6.93 | 7.59 | 8.98 | 8.69 | 8.33 |
| 2000's | 9.53 | 12.34 | 9.37 | 11.48 | 12.70 | 15.38 | 16.93 | 15.70 | 16.58 | 14.25 |
| 2010's | 12.50 | 12.55 | 12.19 | 11.83 | 11.88 | 11.57 | 11.31 | 13.29 | 12.11 | 12.88 |
| 2020's | 13.23 | 14.12 | 17.20 | 17.33 | 16.42 | NA |
| - = No Data Reported; -- = Not Applicable; NA = Not Available; W = Withheld to avoid disclosure of individual company data. |
| Release Date: 6/30/2026 |
| Next Release Date: 7/31/2026 |