|
Download Data (XLS File) |
|
||||||||
|
||||||||
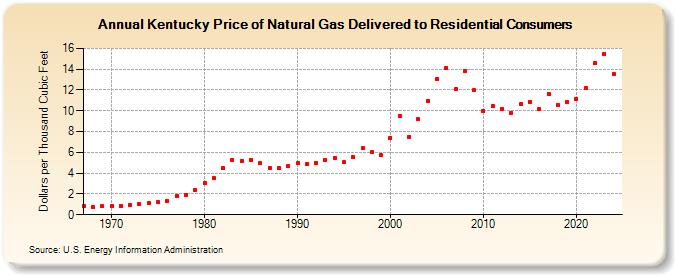
| Kentucky Price of Natural Gas Delivered to Residential Consumers (Dollars per Thousand Cubic Feet) | ||||||||
| Decade | Year-0 | Year-1 | Year-2 | Year-3 | Year-4 | Year-5 | Year-6 | Year-7 | Year-8 | Year-9 |
|---|---|---|---|---|---|---|---|---|---|---|
| 1960's | 0.84 | 0.79 | 0.80 | |||||||
| 1970's | 0.83 | 0.88 | 0.93 | 0.99 | 1.10 | 1.23 | 1.32 | 1.79 | 1.94 | 2.35 |
| 1980's | 3.03 | 3.49 | 4.46 | 5.30 | 5.20 | 5.31 | 4.93 | 4.53 | 4.48 | 4.68 |
| 1990's | 4.93 | 4.87 | 5.01 | 5.25 | 5.46 | 5.05 | 5.54 | 6.37 | 6.03 | 5.72 |
| 2000's | 7.41 | 9.54 | 7.52 | 9.17 | 10.97 | 13.09 | 14.14 | 12.05 | 13.84 | 11.97 |
| 2010's | 10.02 | 10.44 | 10.19 | 9.80 | 10.62 | 10.87 | 10.14 | 11.62 | 10.56 | 10.85 |
| 2020's | 11.14 | 12.21 | 14.58 | 15.50 | 13.61 | 14.23 |
| - = No Data Reported; -- = Not Applicable; NA = Not Available; W = Withheld to avoid disclosure of individual company data. |
| Release Date: 6/30/2026 |
| Next Release Date: 7/31/2026 |