|
Download Data (XLS File) |
|
||||||||
|
||||||||
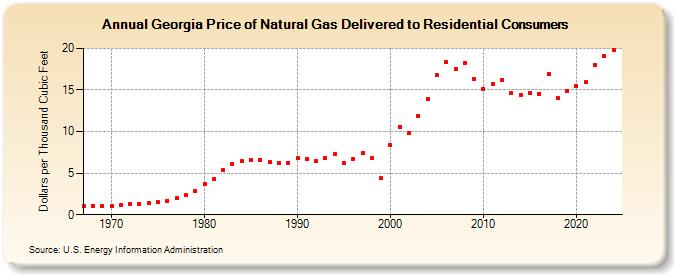
| Georgia Price of Natural Gas Delivered to Residential Consumers (Dollars per Thousand Cubic Feet) | ||||||||
| Decade | Year-0 | Year-1 | Year-2 | Year-3 | Year-4 | Year-5 | Year-6 | Year-7 | Year-8 | Year-9 |
|---|---|---|---|---|---|---|---|---|---|---|
| 1960's | 1.03 | 1.02 | 1.02 | |||||||
| 1970's | 1.05 | 1.13 | 1.26 | 1.30 | 1.40 | 1.50 | 1.69 | 1.97 | 2.33 | 2.88 |
| 1980's | 3.67 | 4.34 | 5.33 | 6.10 | 6.41 | 6.60 | 6.63 | 6.34 | 6.22 | 6.25 |
| 1990's | 6.82 | 6.70 | 6.44 | 6.80 | 7.32 | 6.18 | 6.69 | 7.41 | 6.78 | 4.37 |
| 2000's | 8.38 | 10.58 | 9.86 | 11.86 | 13.92 | 16.76 | 18.37 | 17.53 | 18.26 | 16.30 |
| 2010's | 15.17 | 15.72 | 16.23 | 14.60 | 14.45 | 14.62 | 14.56 | 16.93 | 13.98 | 14.88 |
| 2020's | 15.45 | 15.91 | 18.06 | 19.03 | 18.19 | 20.42 |
| - = No Data Reported; -- = Not Applicable; NA = Not Available; W = Withheld to avoid disclosure of individual company data. |
| Release Date: 6/30/2026 |
| Next Release Date: 7/31/2026 |