|
Download Data (XLS File) |
|
||||||||
|
||||||||
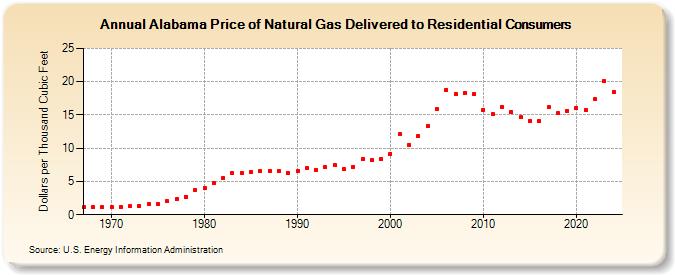
| Alabama Price of Natural Gas Delivered to Residential Consumers (Dollars per Thousand Cubic Feet) | ||||||||
| Decade | Year-0 | Year-1 | Year-2 | Year-3 | Year-4 | Year-5 | Year-6 | Year-7 | Year-8 | Year-9 |
|---|---|---|---|---|---|---|---|---|---|---|
| 1960's | 1.13 | 1.10 | 1.09 | |||||||
| 1970's | 1.13 | 1.19 | 1.27 | 1.37 | 1.55 | 1.57 | 1.99 | 2.31 | 2.71 | 3.65 |
| 1980's | 4.04 | 4.77 | 5.58 | 6.22 | 6.26 | 6.41 | 6.52 | 6.64 | 6.51 | 6.27 |
| 1990's | 6.57 | 7.05 | 6.74 | 7.10 | 7.41 | 6.86 | 7.22 | 8.35 | 8.21 | 8.34 |
| 2000's | 9.19 | 12.06 | 10.53 | 11.82 | 13.34 | 15.82 | 18.80 | 18.14 | 18.30 | 18.12 |
| 2010's | 15.79 | 15.08 | 16.20 | 15.47 | 14.62 | 14.13 | 14.06 | 16.12 | 15.22 | 15.63 |
| 2020's | 16.01 | 15.72 | 17.36 | 20.10 | 18.63 | 17.56 |
| - = No Data Reported; -- = Not Applicable; NA = Not Available; W = Withheld to avoid disclosure of individual company data. |
| Release Date: 6/30/2026 |
| Next Release Date: 7/31/2026 |
Referring Pages: