Increases in oil prices affect broader measures of inflation
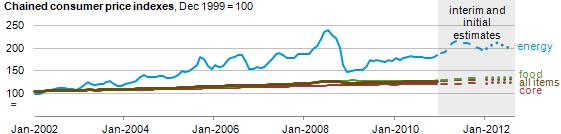
Note: The Core C-CPI-U excludes food and energy. The C-CPI-U estimates for 2011 and 2012 are interim and initial, respectively, and are subject to revision.
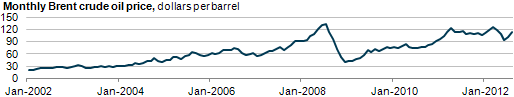
While a barrel of light sweet crude oil may never make it onto the shopping list of the typical U.S. consumer, the effects of world oil price hikes on consumer prices have been highly correlated for some time. Over the past ten years, the Chained Consumer Price Index (C-CPI-U)—a measure of change in the cost of living—for energy (the blue line in the top chart) has approximately tracked the movements of the international Brent crude oil price (shown in the lower chart). Rising energy and food prices have led the "all items" cost of living index to modestly exceed "core" inflation, which excludes volatile food and energy costs.
A price index is a measure of change in the purchasing power of a currency. A rising price index means a decrease in real income for consumers whose pay remains unchanged—because of higher prices, their money buys less. EIA uses price indexes to convert nominal fuel prices to constant dollar prices for comparison across time. Price indexes are also used to adjust income tax brackets and as economic indicators of inflation.
The Bureau of Labor Statistics (BLS) publishes the monthly All-Items C-CPI-U, which measures changes in the cost of living for U.S. consumers. BLS calculates price changes for individual consumer items and aggregates theses changes into price index series, using weights representing household expenditure shares. Housing costs, for example, account for about 30% of the expenditure weight in the C-CPI-U. The weights vary by month, reflecting changes in spending patterns that may be driven, in part, by price changes. Thus the C-CPI-U accounts for consumers' tendency to substitute cheaper products for more expensive ones when relative prices change.
Energy expenditures, including utilities and motor fuel, account for roughly 10% of the expenditure weight in the C-CPI-U. In addition to pushing up prices for consumer energy products such as gasoline and propane, oil price increases boost freight transportation costs—for example, transporting food items to the grocery store. Food accounts for about 15% of the expenditure weight in the All-Items C-CPI-U. Over the past ten years, the All-Items C-CPI-U (the brown line) has diverged upward from the Core C-CPI-U (the red line), which excludes food and energy.
Although residential natural gas prices have decreased by nearly 10% over the past year, the effects of these decreases on the All-Items C-CPI-U have been minimal. During the ten-year period shown in the graph, natural gas has, on average, made up only about 1% of household expenditures—roughly the same as alcoholic beverages. If natural gas prices remain low, however, consumer substitution of natural gas for heating oil and other fuels may eventually reduce the influence of oil prices on overall energy and consumer prices.
Tags: Brent, crude oil, liquid fuels, oil/petroleum, prices