New pipeline project could lower natural gas transportation costs to New York City
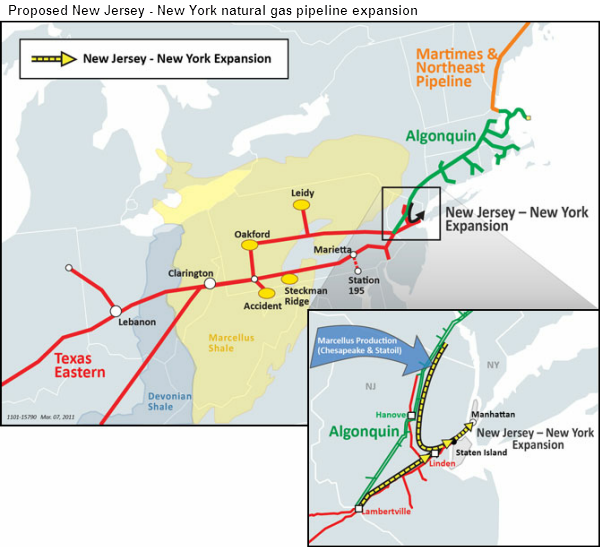
Note: In the map, the white squares are compressor stations, the yellow circles are natural gas storage fields, and the white circles indicate interconnections with pipelines.
Future natural gas transportation costs to New York City could be reduced with the expansion of the existing Texas Eastern Transmission pipeline from Linden, New Jersey to Manhattan, New York (see map above). On May 22, 2012, the Federal Energy Regulatory Commission (FERC)—the main jurisdictional authority over the construction of interstate natural gas pipelines in the United States—approved an 800,000 million British thermal unit (MMBtu) per day, or 800,000 dekatherms per day, expansion of the pipeline.
This project is slated to begin service in November 2013 and represents one of the biggest transportation service expansions in the Northeast during the past two decades. The project could have the following effects on the New York City market: reduce reliance on oil-fired generators, enhance the reliability of natural gas supplies, and lower transportation costs—especially in the winter. Spectra Energy secured firm transportation agreements for this expansion with these customers: Consolidated Edison (170,000 MMBtu per day); Chesapeake Energy Marketing, Inc. (425,250 MMBtu per day); and Statoil Natural Gas LLC (204,750 MMBtu per day).
The spread between the price of natural gas at a supply location like the Henry Hub in Erath, Louisiana and a delivery market such as New York City can be quite high on congested parts of the natural gas grid, especially in the winter. For example, on a peak winter day in January 2004, the spread peaked at about $50/MMBtu—meaning the Transco Zone 6 NY price was more than nine times the Henry Hub price—as pipelines into the New York market area were highly constrained. As shown in the graph below, spreads in the $5/MMBtu-to-$15/MMBtu range have occurred frequently during December and January.
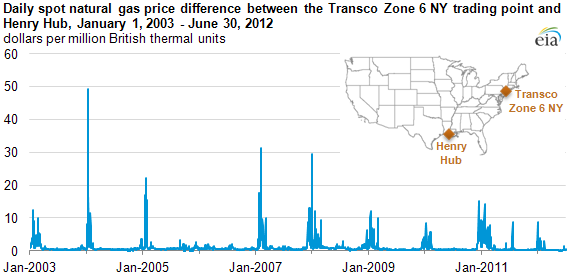
Note: This chart reflects the differences for physical natural gas reported at the Henry Hub and Transco Zone 6 NY trading points.
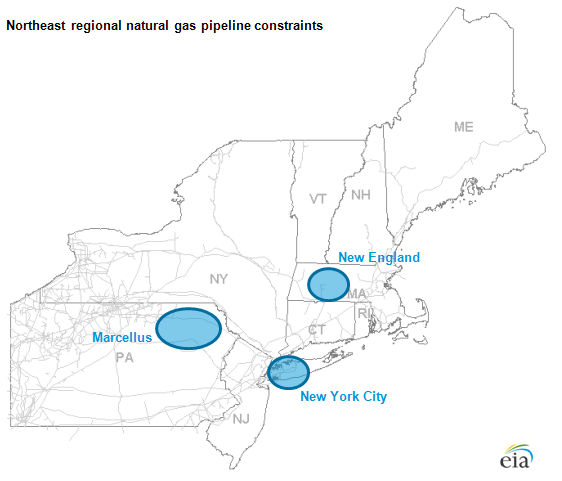
The New York City market reflects one of three major constrained areas on the natural gas grid in the Northeast United States. Bottlenecks exist moving Marcellus natural gas out of Pennsylvania and delivering natural gas into New England, especially in the winter (see map below). Pipeline companies have been adding capacity to the broader Northeast natural gas market. For updates on the status of planned natural gas pipeline infrastructure see EIA's natural gas pipeline data.
Tags: map, Marcellus, natural gas, New England, New Jersey, New York, pipelines, prices