April 5, 2012
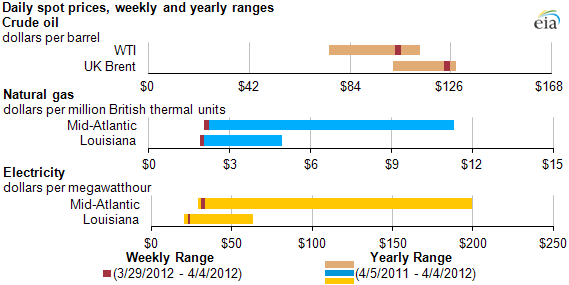
Spot crude prices near 12-month high; natural gas and power prices near 12-month low
Source: U.S. Energy Information Administration, based on Thomson Reuters and SNL Energy.
Note: WTI represents West Texas Intermediate crude oil.
Note: WTI represents West Texas Intermediate crude oil.
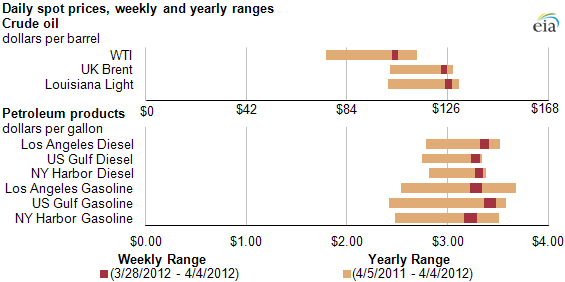
Source: U.S. Energy Information Administration, based on Thomson Reuters and SNL Energy.
Notes: WTI represents West Texas Intermediate crude oil. The price ranges for crude oil and petroleum products are aligned because there are 42 gallons per barrel of crude oil.
Notes: WTI represents West Texas Intermediate crude oil. The price ranges for crude oil and petroleum products are aligned because there are 42 gallons per barrel of crude oil.
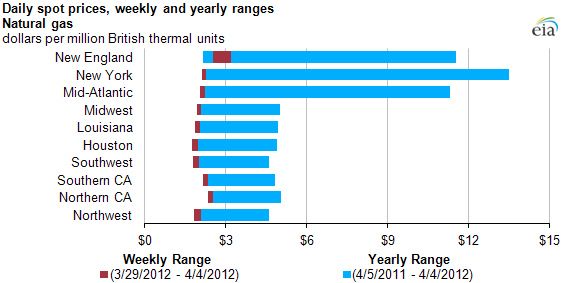
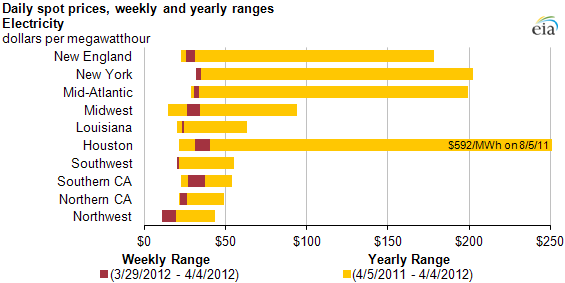
Source: U.S. Energy Information Administration, based on Thomson Reuters and SNL Energy.
Source: U.S. Energy Information Administration, based on Thomson Reuters and SNL Energy.
Key wholesale energy price benchmarks for crude oil, natural gas, and electric power reflect contrasting trends over the past year. International events have contributed to higher wholesale crude oil prices, whereas high levels of domestic natural gas production coupled with mild weather and record storage inventories have lowered wholesale natural gas prices. Because natural gas remains the marginal fuel in most electric power markets and because low heating and cooling demand in recent weeks have reduced electricity demand, electric power prices remain low as well. The figures above compare recent weekly price ranges (for March 29, 2012 - April 4, 2012) to the range of wholesale prices during the past year.