March 15, 2012
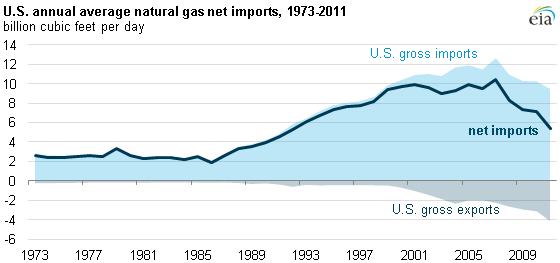
U.S. natural gas net imports at lowest levels since 1992
Source: U.S. Energy Information Administration, Natural Gas Monthly, Table 4 - U.S. Natural Gas Imports and Exports.
Notes: Net imports represent total natural gas imports via pipelines from Canada and Mexico as well as total imports of liquefied natural gas (LNG), minus total natural gas exports via pipelines to Canada and Mexico plus total LNG exports from Alaska, including any re-exports of LNG from U.S. terminals. Re-exported LNG consists of LNG imported to the United States, stored at a U.S. re-gasification terminal for some period of time, and then reloaded onto a tanker for delivery elsewhere.
Notes: Net imports represent total natural gas imports via pipelines from Canada and Mexico as well as total imports of liquefied natural gas (LNG), minus total natural gas exports via pipelines to Canada and Mexico plus total LNG exports from Alaska, including any re-exports of LNG from U.S. terminals. Re-exported LNG consists of LNG imported to the United States, stored at a U.S. re-gasification terminal for some period of time, and then reloaded onto a tanker for delivery elsewhere.
The preliminary estimate of U.S. natural gas average daily net imports—imports minus exports—was just over 5 billion cubic feet per day (Bcfd) in 2011, which was the lowest level since 1992 (see chart above). Net import declines are due to both lower imports and higher exports; U.S. net imports of natural gas peaked in August 2007 at 10 Bcfd, and have fallen markedly since.
Imports
The United States imports natural gas via pipelines from Canada and Mexico, and from tanker deliveries to liquefied natural gas (LNG) terminals. Some key points include:
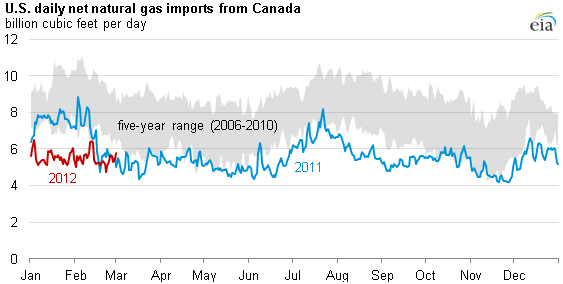
- The vast majority of U.S. natural gas imports arrive via pipeline from Canada (see chart below). Significant increases in U.S. natural gas production have led to decreased U.S. demand for Canadian natural gas. Imports from Canada for 2011 were significantly below the previous five-year range, and have been lower for much of 2012 so far (some of this decline, however, can be attributed to warmer-than-usual weather across much of the United States).
- LNG is the other main source of imported natural gas, however average daily deliveries from U.S. LNG terminals from January 1, 2012 through March 15, 2012 averaged 0.6 Bcf/d, down about 44% from a comparable period in 2011. Higher natural gas prices in competing markets abroad are attracting "spot" LNG cargoes that can be delivered under flexible pricing terms. LNG imports through U.S. terminals peaked in 2007 at over 2.1 Bcfd.
- U.S. natural gas imports from Mexico are negligible, totaling just 2.7 Bcf, or about 7.3 million cubic feet per day in 2011. Imports from Mexico enter primarily through southern Texas and southeastern California.
Source: U.S. Energy Information Administration, based on Bentek, LLC.
Exports
U.S. exports of natural gas are up over the past decade. Some key factors underpinning the growth in exports are:
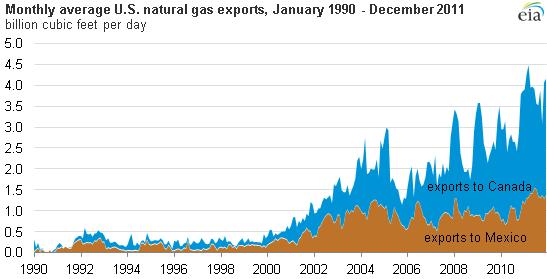
- Domestic natural gas production is growing, primarily from shale gas formations. Some of this production is being shipped on pipelines into Canada and Mexico (see chart below).
- Much of the growth in natural gas exports to Canada is due to increased deliveries on U.S. pipelines to natural gas storage facilities in Ontario.
- Exports to Mexico reached a high in 2011, averaging almost 1.4 Bcfd for the year, exceeding the previous high of 1.1 Bcfd in 2004.
Source: U.S. Energy Information Administration, Natural Gas Monthly, Table 4 - U.S. Natural Gas Imports and Exports.