2011 Brief: Wholesale electricity prices mostly lower in 2011
This article continues a series of briefs on energy market trends in 2011.
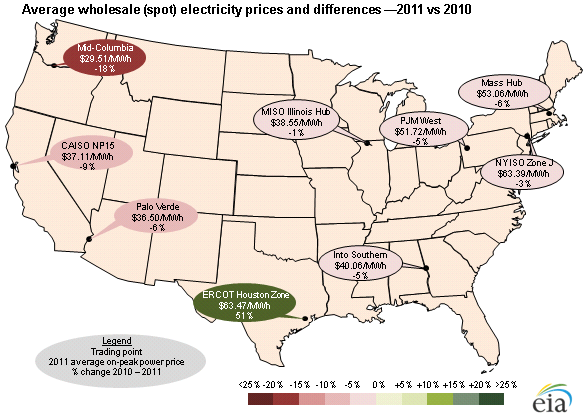
Average, on-peak day-ahead electricity prices were lower across most of the United States in 2011. The largest exception was in the ERCOT region (most of Texas) where sustained, widespread, extreme heat resulted in record-breaking load levels and unprecedented prices. Significant hydroelectric supply in the Northwest lowered average wholesale power prices in the Northwest and Northern California.
Declines in natural gas wholesale prices averaging 5-9% across major trading points contributed to lower on-peak electricity prices in 2011. However, several isolated events drove large changes in day-ahead, on-peak electricity prices throughout 2011. Selected topics are illustrated in the following chart (click on the chart text for more information).
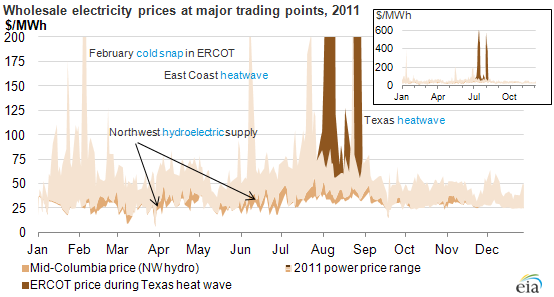
Note: Data include day-ahead, on-peak prices from Mid-Columbia, CAISO NP-15, CAISO SP-15, Palo Verde, PJM N. Illinois Hub, ERCOT Houston Zone, Entergy, PJM Western Hub, NYISO Zone J, NE-ISO Mass Hub, MISO Illinois Hub, and Into Southern pricing points.