Strong finish to 2011 natural gas storage injection season on Oct. 31
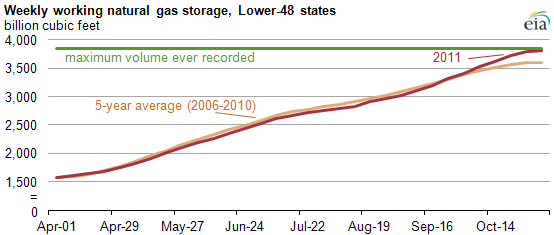
Note: Traditionally the injection season runs from April 1 through October 31. Due to the reporting cycle of the Weekly Natural Gas Storage Report, the working gas in storage estimate for October 31 is interpolated from data for the weeks ending October 28 and November 4.
Download CSV Data
Working natural gas inventories as of October 31 were 3,810 billion cubic feet (Bcf), following exceptionally large storage builds at the end of the 2011 injection season. From September 1 through October 31, net injections into underground storage facilities totaled 858 Bcf, more than 45% higher than the 5-year average injections of 591 Bcf for that same time period. The boost in injections during September and October resulted from lower demand due to mild weather across much of the United States, coupled with continued strong production. The end of October marks the traditional end of the injection season and the beginning of the winter heating season, although relatively small net injections often continue into November.
Although natural gas inventories started the injection season strong, for the total lower-48 States they were below last year's levels. Inventories in the Producing Region were at their highest level for that time of year since the data series began; and both the East Region and West Region's inventory levels were above the 5-year average for that time of year.
The first month of the injection season saw periods of cooler-than-normal weather, which contributed to the lower level of net injections during that time. Then, an unusually warm summer in parts of the South, notably in Texas, led to increased natural gas consumption in the electric power sector. This was a factor in the six weeks of withdrawals from storage in the Producing region during mid-July through August (see chart below).
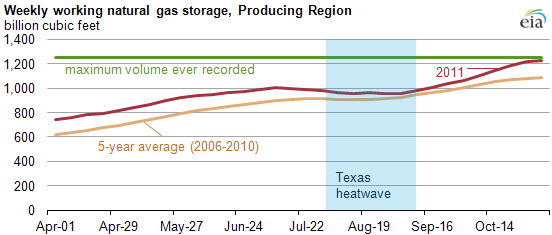
Note: Traditionally the injection season runs from April 1 through October 31. Due to the reporting cycle of the Weekly Natural Gas Storage Report, the working gas in storage estimate for October 31 is interpolated from data for the weeks ending October 28 and November 4.
Download CSV Data
EIA's November 2011 Short-Term Energy Outlook (STEO) projects that storage operators will withdraw 2,000 Bcf from storage during the 2011-2012 winter heating season as a result of continuing strong production levels and a warmer winter forecast. This level of withdrawals would place stocks as of March 31, 2012 at 1,809 Bcf, the highest end-of-March level since 1991.