Record U.S. electricity generation in 2018 driven by record residential, commercial sales
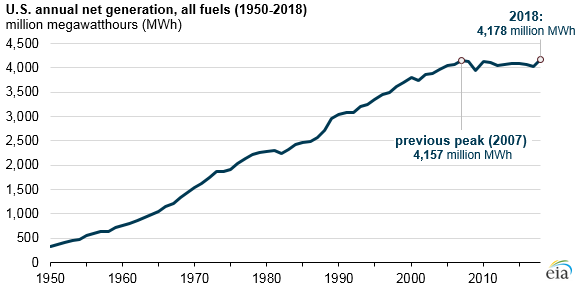
U.S. net electricity generation increased by 4% in 2018, reaching a record high of 4,178 million megawatthours (MWh), according to EIA’s Electric Power Monthly. Last year was the first time total utility-scale generation surpassed the pre-recession peak of 4,157 million MWh set in 2007. Weather is the primary driver of year-to-year fluctuations in electricity demand. The increased demand for electricity in 2018—including record demand in the commercial and residential sectors—is largely attributable to cold winters and a hot summer.
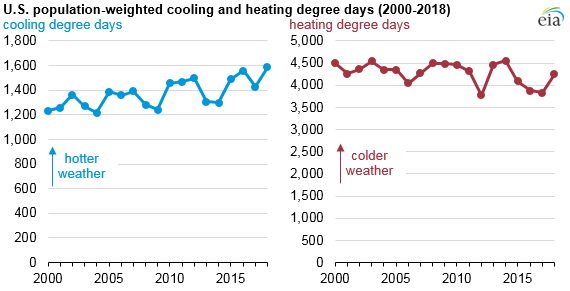
Population-weighted cooling degree days, an indicator of warm weather and air conditioning demand, reached a record high in 2018. Heating degree days, the corresponding indicator of cold weather and space heating demand, were also higher in 2018 than in recent years. Electricity is the primary fuel used for air conditioning, but a variety of fuels are used to meet demand for space heating. Consequently, cooling degree days have a greater influence on overall electricity generation than heating degree days.
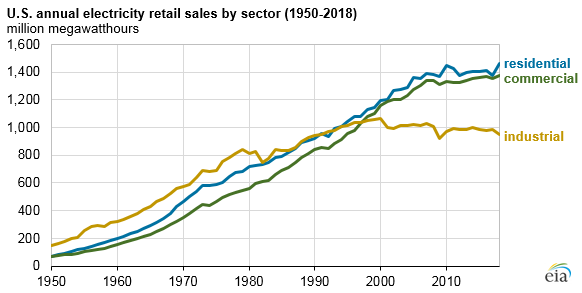
Both the residential and commercial sectors reached all-time highs for retail sales of electricity in 2018. About 87% of U.S. households cool their homes in the summer with air conditioning, and about 35% of homes use electricity as their primary heating source during the winter. The hot summer and relatively cold winter months of 2018 contributed to increased retail electricity sales to the sector, up 6% from the previous year.
Electricity use in commercial buildings is also affected by the weather but to a lesser degree; electricity sales to the commercial sector last year increased 2% from 2017. Electricity use in the industrial sector has been relatively unchanged in recent years, with 2018 electricity sales to this sector 3% lower than in 2017. The remaining sales of electricity EIA tracks are used in transportation and routinely account for less than a quarter of a percent of sales.
Retail sales of electricity do not include distributed generation, such as electricity generated by small-scale solar PV systems installed on residential rooftops. These systems reduce the amount of electricity that consumers need to buy from the electric grid. Although small-scale solar PV generation has grown, its output was not enough to meet increased demand for electricity in 2018. In 2018, customer-sited solar installations produced an estimated 30 million MWh of electricity, compared with less than one million MWh in 2007.
In the long term, EIA projects that electricity consumption will continue to grow but at a slower pace than in recent decades. Economic and population growth are the primary drivers of rising electricity demand, with the number of households growing 0.7% per year and commercial floorspace increasing 1.0% per year from 2018 through 2050 in EIA’s Annual Energy Outlook 2019 Reference case. Electricity sales to the residential and commercial sectors are expected to grow more slowly, at 0.4% and 0.5%, respectively, as improvements in technology and energy efficiency standards moderate electricity consumption growth.
EIA’s preliminary data for all months in 2018 for the U.S. electric power sector is now available in the Electric Power Monthly.
Principal contributor: Maggie Woodward
Tags: residential, commercial, generation, electricity